Use our data visualisation tool for your next project
Since we began as a company 5 years ago, we've focused on using real wildlife data to tell conservation stories through games and interactive digital experiences. To evaluate if the data was suitable for storytelling and what those stories might tell, we built our own visualisation tool. Now, we’re opening up this tool to the world, so it can be of use to other researchers and storytellers.
THE PROBLEM
Our first ideas and prototypes involved working with animal movement data (i.e. data from GPS tags), and thanks to our research and conservation partners' incredible enthusiasm and willingness to share their hard-earned data with us, we were quickly swamped with a lot of tracking data.
So, to get the most out of them and find the most visually appealing stories, we needed a quick and efficient way to view the data and share it within the IoE team which is spread around the globe. Looking at the raw data itself on a spreadsheet just wasn't going to cut it.
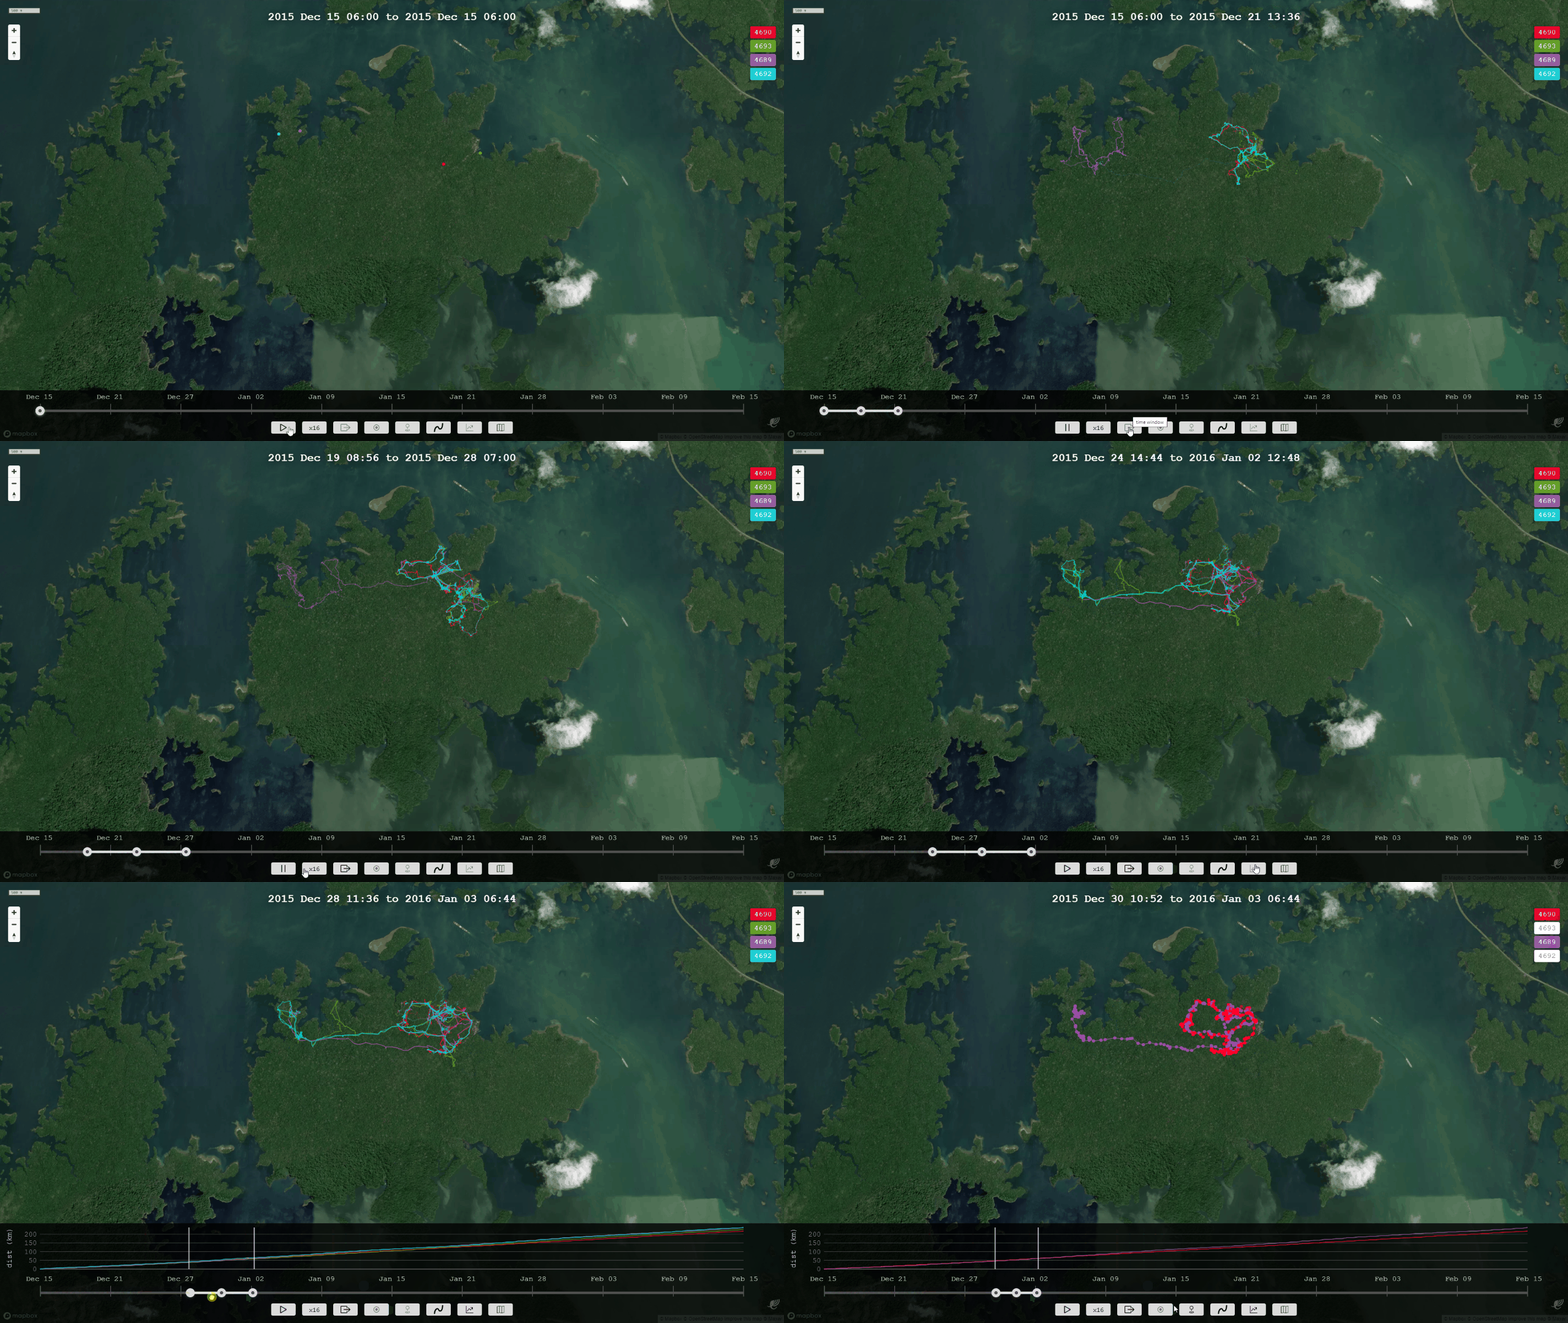
While there are loads of amazing GIS tools for viewing and analysing spatial data, there was (is?) nothing out there that lets you easily playback movement data like a video on an interactive map - no installing software, manipulating the data, or coding required. (we're not all literate in R here at IoE).
OUR SOLUTION
We got to work on creating a tool that met our specific needs: give it a file with movement data and watch your animals go... zoom in, zoom out, look at a specific time window... all through the browser. There's also a handy graph, so you can see how far your animals have moved. And we added a few different map styles, just because we can. We even added video-creating capabilities in case we wanted to share a specific scene, without the interactivity.
HOW YOU CAN USE IT
We realized the tool could be really helpful for conservation students, researchers, and practitioners who can always use a hand when it comes to increasing the visibility of the amazing work they are doing. And of course, communication professionals who have access to movement data and who would want to use it to tell stories. We're happy to help in any way we can, so we've decided to let everyone and anyone use the tool.
If you've got a story to tell with your GPS data on social media or in a talk, why not include a video - it's now super easy to do!
Or if you're sharing your movement data with a colleague, why not give them the link to our data visualiser so they can quickly explore the data themselves?
DID WE MENTION IT’S FREE?
It's free. No accounts, no downloads, and no sharing data with us required. Best of all, it's open source, so if you find that it's useful but wished it had an extra feature or two, you can help build those features and make it a better tool!
GIVE IT A TRY
Find the tool here, where you can also have a look at the code, contribute, report a bug or see what's next. If you like it, spread the word!
